
Programmers make so many mistakes—literally all the time!—that they gave their mistakes a nickname:
Table of Contents
Bugs. 🦟
The process of finding and fixing bugs in code is called debugging. Ask any computer programmer, and you’ll find that debugging is a big part of their day-to-day work.
If you’ve been coding for a while, you’ve probably done your share of debugging, too. Because debugging is such a common problem, you can use tools called debuggers to help you find and fix bugs while coding.
Unfortunately, debuggers can’t magically fix your code. But they can do things like:
- 🛑 stop the execution of code at important points, and
- 🔎 monitor the value of variables and Actor properties
BTW. The term “bug” was popularized by computer scientist Grace Hopper, when she discovered that a moth had landed in her computer, causing it to malfunction.
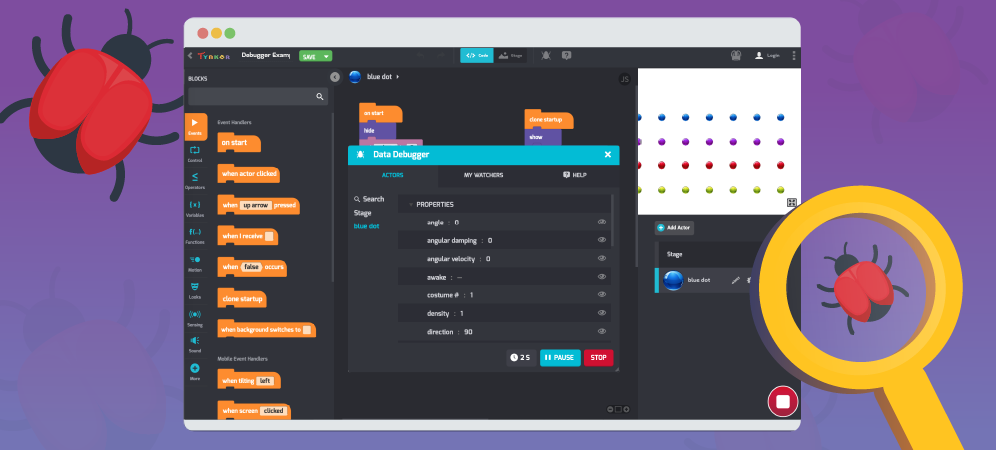
Tynker’s Debugger
Click the Bug icon at the top of the screen, and you’ll see the debugger window.
Once it’s open, you can switch between several tabs: Actors, My Watchers, and Help. Start by looking at the Actors tab.
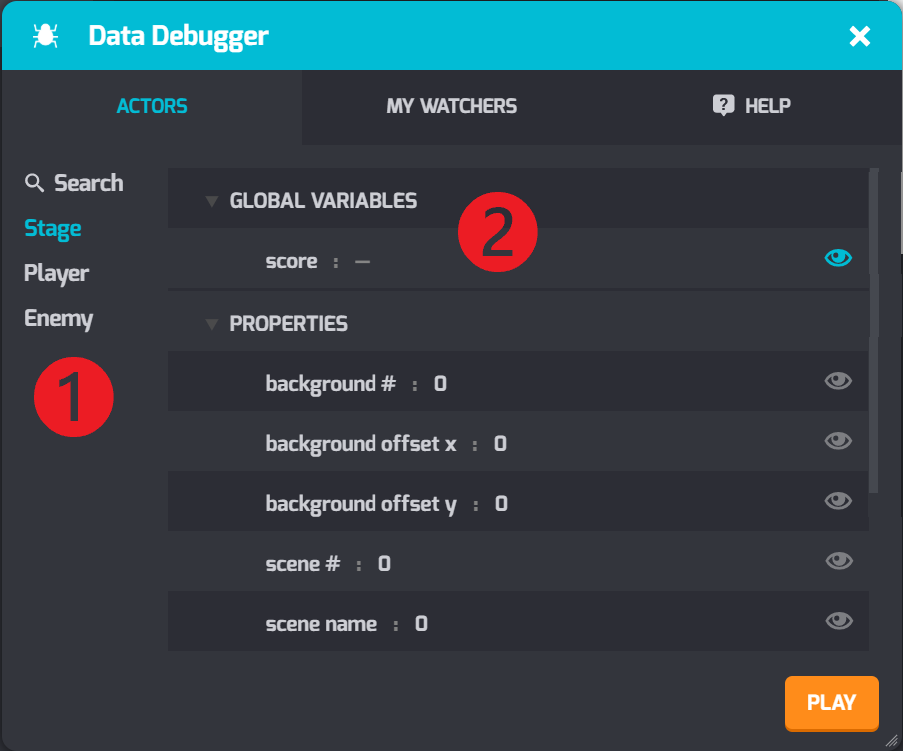
❷ The Stage will list any global variable used in the project.
In the example above, the Stage shows the global variable named score.
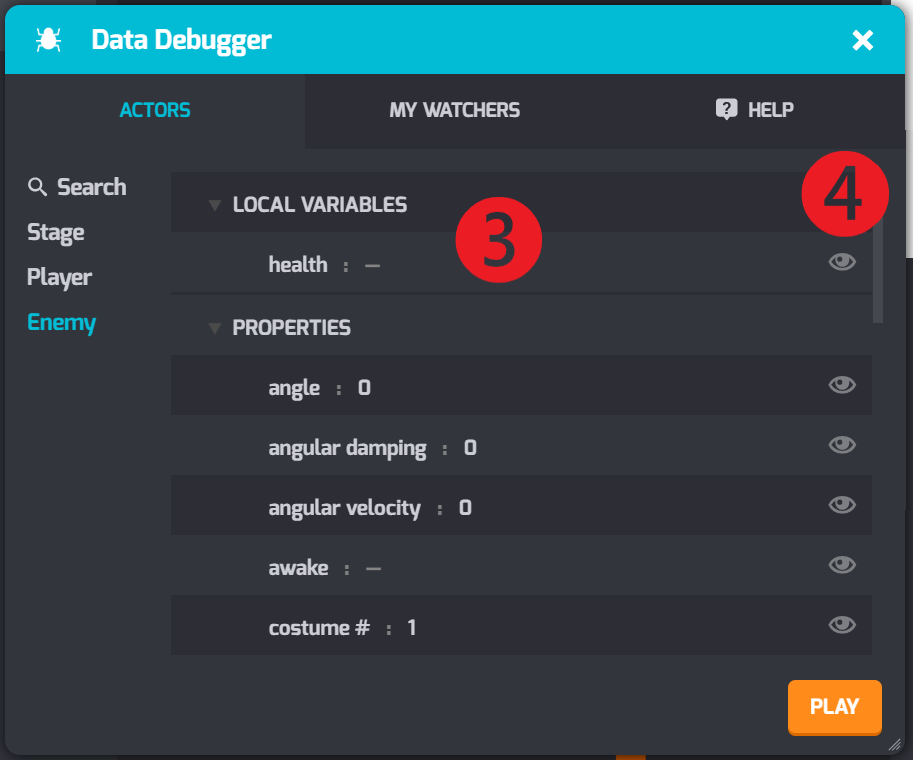
For example, the Enemy Actor in this program has a local variable named health.
❹ Click the Eye icon to create a Watcher.
Creating Watchers
Looking at a big list of values can be overwhelming. For example, you might only care about an actor’s y position or the value of a variable or two.
That’s why we use a watcher to closely monitor the value of a variable or property on screen. To create a watcher, click on the Eye button in the Debugger. The example below shows watchers for the Global Variable score and the Player actor’s x position.
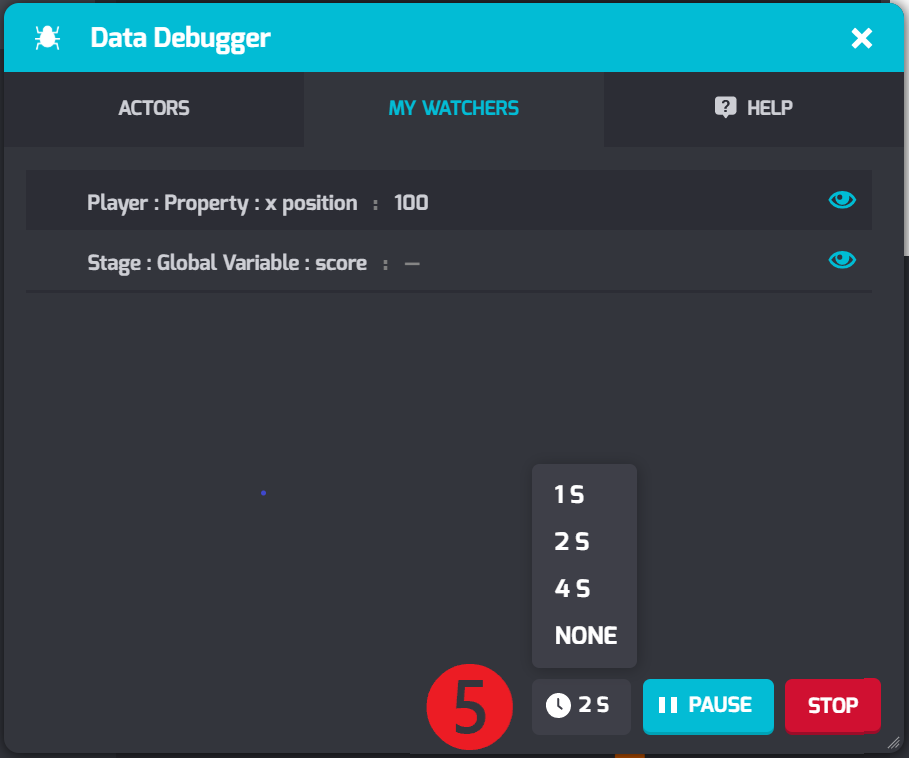
how quickly the debugger checks to see if the value updates.
Breakpoints — Freeze Frame!
The breakpoint block allows you to say “Freeze!” to your program. Your actors will stop moving—but more importantly, your code stops running too.
Breakpoints let you check the value of variables and actor properties to make sure your program is working exactly as you expected. By combining watchers and breakpoints, you can examine your programs at important moments.
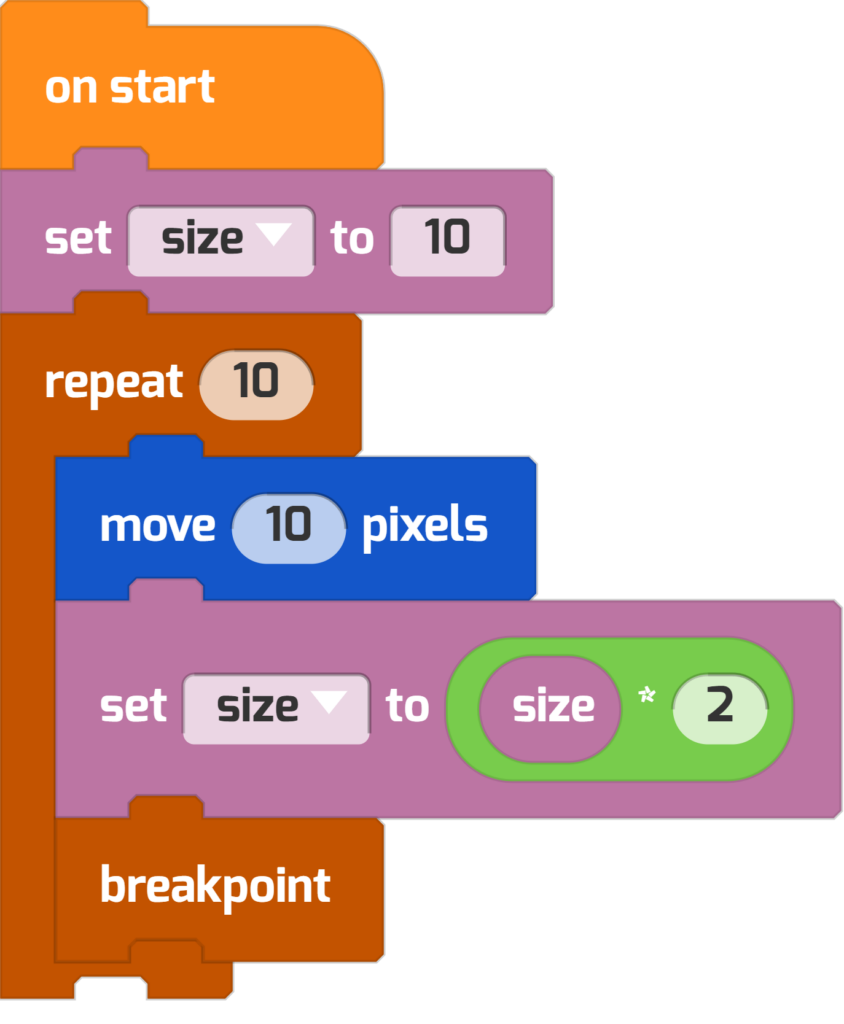
For example, you can use a breakpoint to stop after each iteration of the loop, as shown in the example below:
When a script reaches a breakpoint, the Debugger Window will open, (if it isn’t already).
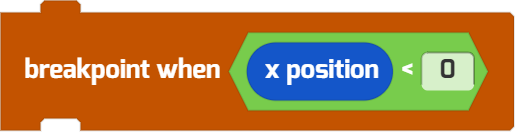
There’s also an advanced breakpoint called a conditional breakpoint. Just like other conditional statements (for example, if-else statements), this breakpoint is expecting a true-or-false expression as its condition.
Other Tricks for Squashing Bugs
Besides the debugger, try these tricks while debugging.
Green Glow.Tynker Workshop highlights each script green as you run it.

If your code doesn’t glow green, it’s not running. In other words, the condition or event that triggers the code isn’t working.
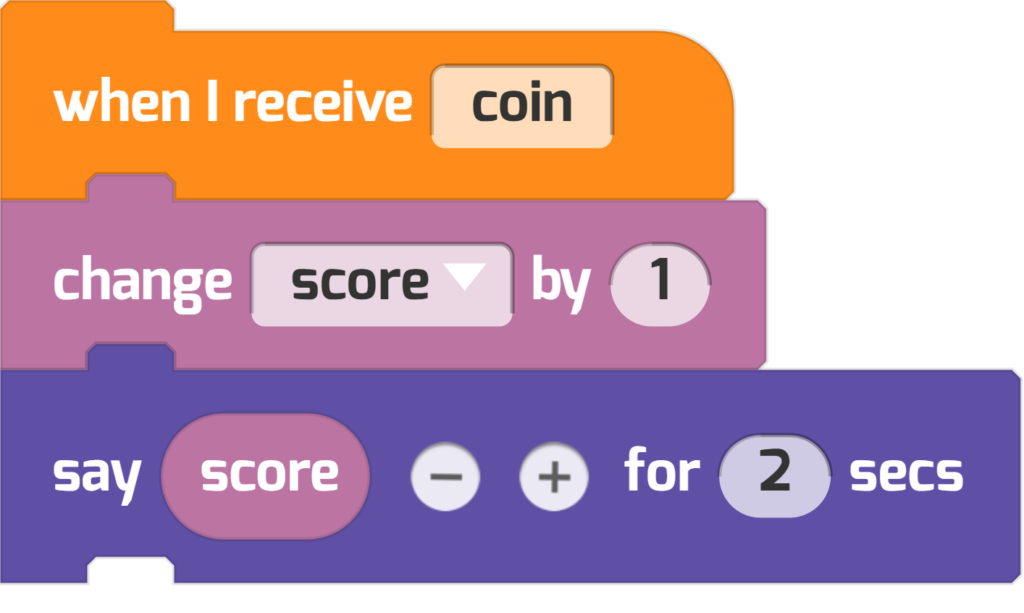
Print Values.You can make your actors report the value of a variable or their own properties on stage using say or set label blocks.
For example, an actor reports the new value of score after it changes:
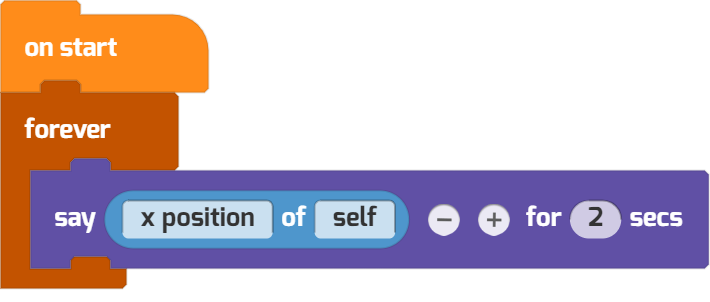
Or use the same trick with the actor properties block:
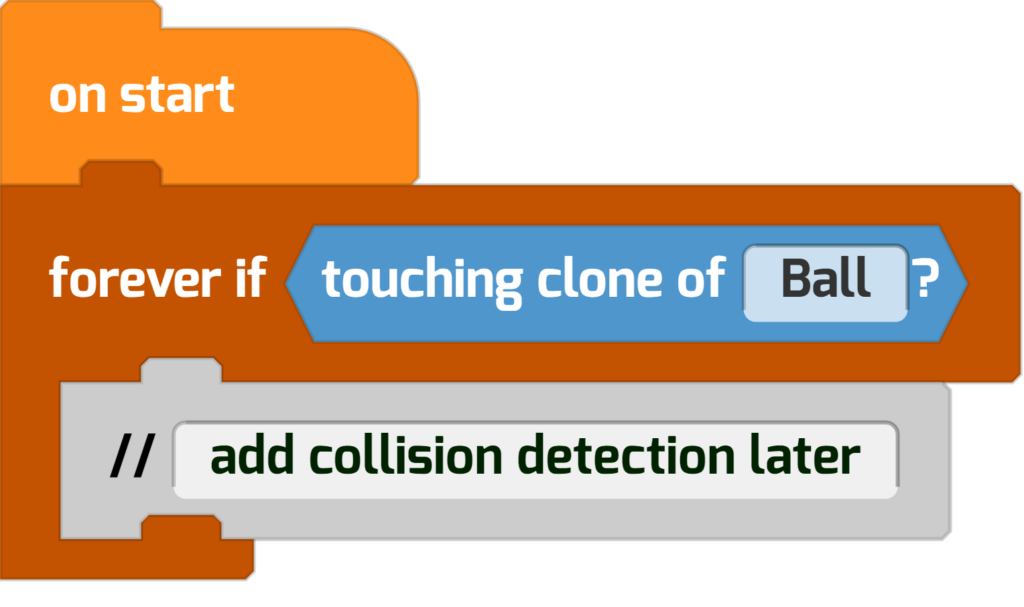
Comment Your Code. Are you making a big project but don’t have time to finish coding it in one sitting? Add comments to your code, reminding you of what needs to be done or isn’t working yet.
Here are a few more tricks for reducing errors and fixing bugs in your code:
- Write code a little bit at a time—run your code as you add features, rather than writing everything all at once.
- Save different versions of your code before making big changes, in case you need to revert. Use Save As to save a different version of your Tynker project.
- Experiment in a new project, testing a small piece of your code—use Tynker’s Backpack to save code so you don’t have to rewrite your script.
- Ask a teacher or another coder for help.
- Get a good night’s sleep and try again tomorrow! The best debugger is a well-rested mind.
Want to practice with the debugger? Check out this buggy project and see if you can make each row of clones a new color. Create a watcher for the variable color and try adding a breakpoint to the outer loop.
Want to use this in your class? Go ahead. Share your own debugging tricks and tips with us at community@tynker.com.
More Activities!
Looking for the next step? Check out these Tynker Toolbox articles!
- Tynker Workshop Basics — Learn about coordinates and start coding with Tynker.
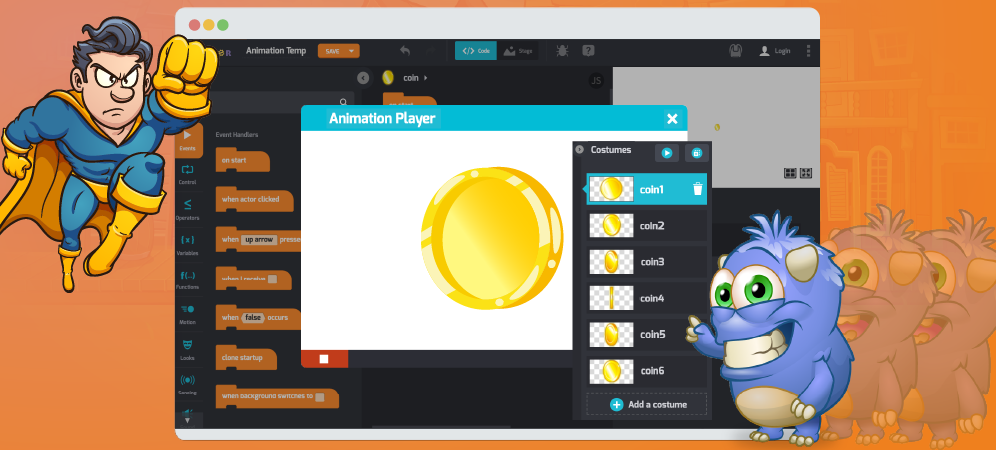
- The Animation Tool — Learn about frame-based animation and other animation tips.
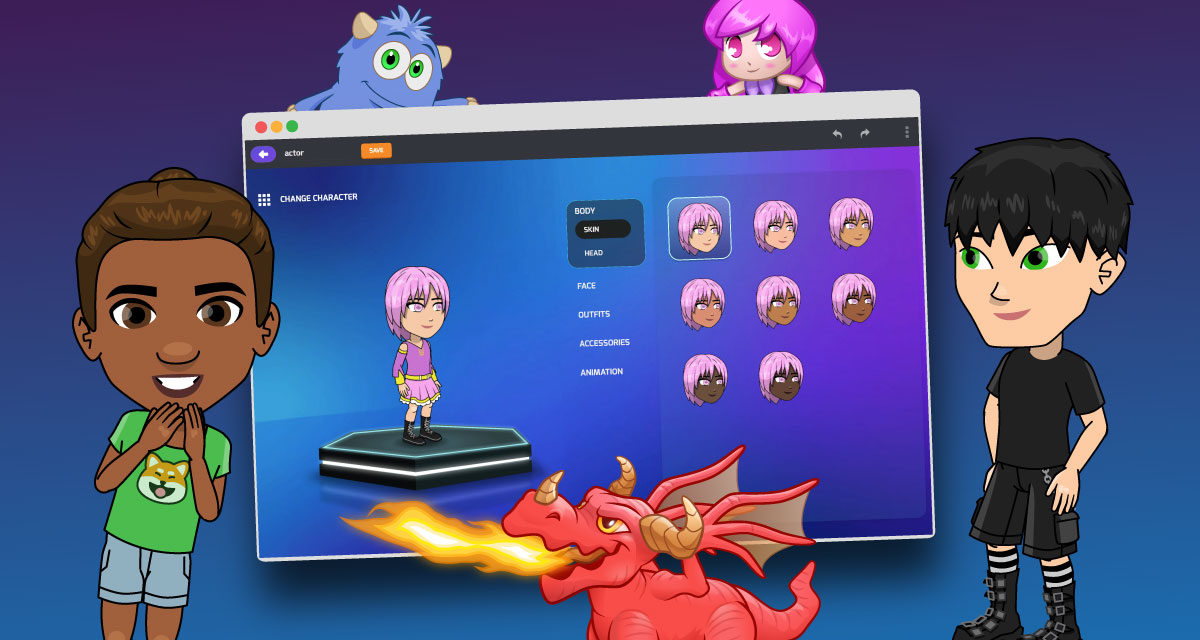
- The Character Creator — Take control of custom rigs using the Animation blocks.
- Text Tricks — Work with speech bubbles and more. Tell your own stories, put on a play, or make a computer write poetry!
- The Sound Blocks — Play music with code! Add custom sound effects, too. Tynker’s brand new music tool supports MIDI and MP3.
- The Synth Blocks — Create your own sound effects and instruments! You can create crunchy dubstep drops, glitchy chiptunes, or instruments from any style of music you can imagine!
- Code Block Tricks — Get top-secret ninja tips for writing code fast in Tynker Workshop.
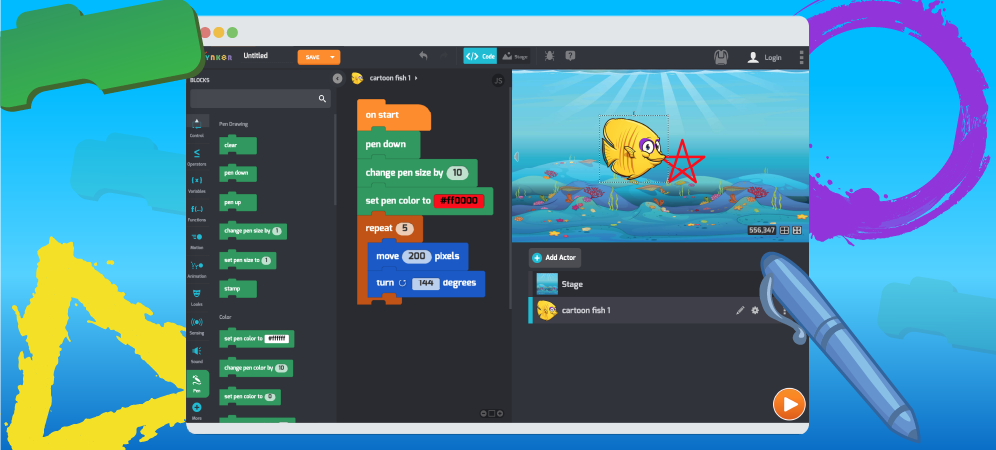
- The Pen Blocks — Make your actors draw as they move. Create patterns, draw geometric shapes, and more.
- The Physics Blocks — Create games or simulations with gravity, collisions, and more. Think: Angry Birds and Marble Madness.
- The Augmented Reality (AR) Blocks — Want to use video or photos in your programs? Try the AR Blocks, which let you code your own selfie!
- The Artificial Intelligence (AI) Blocks — Take your AR projects to the next level with face-, hand-, and pose-tracking. Explore what makes AI special.
- The Tutorial Builder — Did you ever make a really cool Tynker Block project and wish you could teach the whole world exactly how you did it? Now you can!
- The Python Editor — Looking for a challenge? Ready for your next step on your coding journey? Learn Python with Tynker too, and take the plunge into text-based coding.
